New data has revealed just how much home values have surged in 70 of the hottest housing markets across the price spectrum.
Affordable suburbs across Australia have experienced some of the fastest rates of price growth in recent years as buyers have grappled with high interest rates and sought lower-priced areas.
But the latest PropTrack data shows that there are dozens of suburbs where home values have lifted by hundreds of thousands of dollars in just a year across every price range.
The PropTrack data examines the suburbs where median house prices grew most in the past year across a range of price brackets.
In these suburbs, the data suggests property owners have reaped huge equity gains in a short space of time due to the supply and demand balance tipping in their favour.
In lower price brackets, suburbs in booming regional cities of Queensland and Western Australia such as Townsville, Gladstone and Bunbury recorded the strongest growth.

House prices in Beachlands in Geraldton have jumped $171,000 in just 12 months, but the median house price is still under $500,000. Picture: realestate.com.au/sold
In multi-million dollar markets, premium suburbs of Perth and Brisbane notched the biggest gains.
But when it came to the upper echelons of the property market where homes typically trade for $3 million or more, almost all the top growth suburbs were in Sydney, Australia’s largest and priciest city.
In some of these high-end suburbs, all that’s required to make $1 million in a year — on paper at least — is owning a typical house.
Jump ahead to see the top growth suburbs priced:
Booming but affordable
The most rapid house price gains in the past year have largely been recorded in suburbs of affordable regional cities experiencing increased interest off the back of strong rental demand.
Three of the top 10 suburbs for house price growth under $500,000 were found in Townsville, one of the top booming regional markets in the country, while two were in Gladstone and one was in Rockhampton.
Top growth suburbs under $500,000
| Suburb | State | Region (SA4) | Median house price | 12 month change ($) | 12 month change (%) | |
| 1 | Beachlands | WA | Western Australia – Outback (South) | $491,000 | $171,000 | 53% |
| 2 | Vincent | QLD | Townsville | $466,000 | $141,000 | 43% |
| 3 | Garbutt | QLD | Townsville | $500,000 | $140,000 | 39% |
| 4 | South Gladstone | QLD | Central Queensland | $500,000 | $130,000 | 35% |
| 5 | Gladstone Central | QLD | Central Queensland | $465,000 | $127,500 | 38% |
| 6 | Boddington | WA | Western Australia – Wheat Belt | $440,000 | $127,500 | 41% |
| 7 | Dundee Beach | NT | Northern Territory – Outback | $410,000 | $125,000 | 44% |
| 8 | West Rockhampton | QLD | Central Queensland | $500,000 | $125,000 | 33% |
| 9 | Heatley | QLD | Townsville | $473,000 | $123,000 | 35% |
| 10 | Rasmussen | QLD | Townsville | $490,000 | $120,000 | 32% |
Regional Queensland has been the third-fastest growing regional market in the past year, with four of the top five regional cities by house price growth found in the Sunshine State.
Competitive conditions in these cities, which have pitted interstate investors rushing to buy high-yield rental properties against locals battling to get into the market, have helped push values to new highs.
Prices in Vincent in Townsville have exploded, but affordability challenges may slow further growth. Picture: realestate.com.au/sold
Townsville real estate agent Jools Munro of Explore Property Munro & Co said prices in several rapidly-growing lower-priced suburbs were reaching the limits of affordability.
“A lot of growth has come from our more humble older suburbs, for example Vincent and Heatley,” she said. “We feel that those suburbs may be close to their ceiling.”
Top growth suburbs between $500,000 and $750,000
| Suburb | State | Region (SA4) | Median house price | 12 month change ($) | 12 month change (%) | |
| 1 | Girards Hill | NSW | Richmond – Tweed | $528,000 | $203,000 | 63% |
| 2 | Lismore | NSW | Richmond – Tweed | $550,000 | $180,000 | 49% |
| 3 | Cannington | WA | Perth – South East | $700,444 | $175,444 | 33% |
| 4 | Tivoli | QLD | Ipswich | $646,000 | $173,100 | 37% |
| 5 | Ridgewood | WA | Perth – North West | $715,000 | $172,500 | 32% |
| 6 | Pimlico | QLD | Townsville | $560,000 | $170,000 | 44% |
| 7 | Aitkenvale | QLD | Townsville | $530,000 | $160,000 | 43% |
| 8 | Bullsbrook | WA | Perth – North East | $750,000 | $160,000 | 27% |
| 9 | St Clair | SA | Adelaide – West | $710,000 | $152,750 | 27% |
| 10 | Middle Swan | WA | Perth – North East | $622,500 | $152,000 | 32% |
The next price bracket up, $500,000 to $750,000, featured more Perth suburbs, with typical prices jumping as much as $175,000 in 12 months even as the city’s booming market slows.
A typical house in Cannington in Perth’s south now costs about $700,000, with values rising at a brisk 33% in the past year alone.
Relatively affordable suburbs such as Cannington in Perth have experienced rapid price rises in recent years. Picture: realestate.com.au/sold
Most of the top-growth suburbs with median prices between $750,000 and $1 million were found in Perth and Adelaide, and all were priced at the top of that range.
Top growth suburbs between $750,000 and $1 million
| Suburb | State | Region (SA4) | Median house price | 12 month change ($) | 12 month change (%) | |
| 1 | Madeley | WA | Perth – North West | $955,000 | $242,500 | 34% |
| 2 | Wondunna | QLD | Wide Bay | $900,000 | $222,500 | 33% |
| 3 | Darch | WA | Perth – North West | $995,000 | $221,675 | 29% |
| 4 | Port Elliot | SA | South Australia – South East | $990,000 | $212,500 | 27% |
| 5 | Gulfview Heights | SA | Adelaide – North | $960,000 | $209,000 | 28% |
| 6 | Wattle Grove | WA | Perth – South East | $932,000 | $202,000 | 28% |
| 7 | Noranda | WA | Perth – North East | $940,000 | $201,000 | 27% |
| 8 | Marion | SA | Adelaide – South | $960,000 | $197,500 | 26% |
| 9 | Tralee | NSW | Capital Region | $977,500 | $195,500 | 25% |
| 10 | Hamersley | WA | Perth – North West | $947,500 | $195,000 | 26% |
The median house prices in both capitals is now above $900,000, according to the latest PropTrack Home Price Index, with values in many of the top growth suburbs under $1 million increasing by more than $200,000 in just a year.
REA Group senior economist Anne Flaherty said suburbs in more affordable parts of Perth and Adelaide had been among the nation’s best performing markets for several years.
“Affordability is a major factor in these markets,” she said. “We’ve seen the median price of a home escalate more rapidly in those areas than any other part of the country.”
“It makes sense that the more affordable pockets of those cities have seen great growth because they attract a larger pool of potential buyers.”
Aspirational areas on the rise
In the $1-1.5 million range — a segment more favoured by owner-occupiers than investors — homes in the top growth suburbs now sell for about $300,000 more than a year ago.
Top growth suburbs between $1 million and $1.5 million
| Suburb | State | Region (SA4) | Median house price | 12 month change ($) | 12 month change (%) | |
| 1 | Woodville | SA | Adelaide – West | $1,125,000 | $469,000 | 72% |
| 2 | South Brighton | SA | Adelaide – South | $1,500,000 | $450,000 | 43% |
| 3 | Bateman | WA | Perth – South West | $1,277,500 | $355,000 | 39% |
| 4 | Clapham | SA | Adelaide – South | $1,273,000 | $324,500 | 34% |
| 5 | Semaphore | SA | Adelaide – West | $1,192,500 | $312,500 | 36% |
| 6 | North Ward | QLD | Townsville | $1,150,000 | $310,000 | 37% |
| 7 | Riverton | WA | Perth – South East | $1,200,000 | $299,000 | 33% |
| 8 | The Vines | WA | Perth – North East | $1,175,000 | $295,000 | 34% |
| 9 | Alfred Cove | WA | Perth – South West | $1,500,000 | $290,000 | 24% |
| 10 | Maleny | QLD | Sunshine Coast | $1,235,650 | $285,650 | 30% |
Top performers include the coastal Adelaide suburbs of South Brighton and Semaphore, and the riverfront Perth suburbs of Alfred Cove and Riverton.
Semaphore real estate agent Kate Smith said the suburb’s beachside location, character homes and “country town feel” draw buyers, while its conservation zoning restricted development and supported house values.
Semaphore, a coastal suburb of Adelaide, is one of the top performing suburbs in the $1-1.5 million price range. Picture: Getty
“It’s very hotly contested,” she said. “A lot of people that move into the area are buying a lifestyle not just a property, and they’re hanging on for the long term.
“It’s tightly held, and when there’s low stock anything that comes to the market gets maximum buyer attention, so we achieve maximum prices.”
Top growth suburbs between $1.5 million and $2 million
| Suburb | State | Region (SA4) | Median house price | 12 month change ($) | 12 month change (%) | |
| 1 | Ardross | WA | Perth – South West | $1,740,000 | $490,000 | 39% |
| 2 | West Leederville | WA | Perth – Inner | $1,810,000 | $480,000 | 36% |
| 3 | Kensington Gardens | SA | Adelaide – Central and Hills | $1,835,000 | $470,000 | 34% |
| 4 | Oakville | NSW | Sydney – Baulkham Hills and Hawkesbury | $1,599,000 | $469,000 | 42% |
| 5 | Kensington Park | SA | Adelaide – Central and Hills | $1,705,000 | $460,000 | 37% |
| 6 | Sherwood | QLD | Brisbane – West | $1,730,000 | $432,491 | 33% |
| 7 | Wilston | QLD | Brisbane Inner City | $1,845,000 | $382,500 | 26% |
| 8 | Wembley Downs | WA | Perth – Inner | $1,900,000 | $380,000 | 25% |
| 9 | Gilberton | SA | Adelaide – Central and Hills | $1,507,000 | $367,000 | 32% |
| 10 | East Hills | NSW | Sydney – Inner South West | $1,590,000 | $362,500 | 30% |
Homeowners in premium inner suburbs of Adelaide, such as Gilberton and Kensington Park, and Perth, such as Ardross and West Leederville, were the big winners in the $1.5-2 million range.
In six suburbs, median house prices rose by almost half a million dollars in 12 months.
Premium price push
They say it takes money to make money, and that’s no more evident than in the top end of the market.
In $2 million-plus price categories, pricier NSW suburbs begin to dominate for growth. These include inner and waterfront suburbs of Sydney, such as Darlinghurst and Dee Why.
Waterfront suburbs such as Coal Point in NSW have had strong price rises in the past year. Picture: realestate.com.au/sold
Coal Point on Lake Macquarie has been catapulted into the $2 million club – a result of high strong results for waterfront properties.
Top growth suburbs between $2 million and $3 million
| Suburb | State | Region (SA4) | Median house price | 12 month change ($) | 12 month change (%) | |
| 1 | Minyama | QLD | Sunshine Coast | $2,775,000 | $870,000 | 46% |
| 2 | Coal Point | NSW | Newcastle and Lake Macquarie | $2,037,500 | $707,500 | 53% |
| 3 | Applecross | WA | Perth – South West | $2,800,000 | $545,000 | 24% |
| 4 | Enfield | NSW | Sydney – Inner West | $2,294,250 | $469,250 | 26% |
| 5 | Darlinghurst | NSW | Sydney – City and Inner South | $2,575,000 | $400,000 | 18% |
| 6 | Kingsford | NSW | Sydney – Eastern Suburbs | $2,850,000 | $399,500 | 16% |
| 7 | Aberfeldie | VIC | Melbourne – Inner | $2,010,000 | $384,000 | 24% |
| 8 | Sylvania Waters | NSW | Sydney – Sutherland | $2,932,500 | $380,500 | 15% |
| 9 | Brookfield | QLD | Brisbane – West | $2,097,000 | $377,000 | 22% |
| 10 | Dee Why | NSW | Sydney – Northern Beaches | $2,828,000 | $353,000 | 14% |
Meanwhile, Sunshine Coast suburb Minyama has stormed towards $3 million status, with its median house price now $870,000 higher than a year ago.
In Sydney $3 million-plus suburbs such as Warrawee and Bronte, as well as Surfers Paradise on the Gold Coast, a typical house now sells for about $1 million more than a year ago.
Typical houses in Bronte are selling for almost $1 million more than a year ago, PropTrack sales data shows. Picture: Getty
Most of the top growth high-end suburbs were clustered around Sydney’s eastern suburbs, lower north shore and northern beaches – Australia’s priciest real estate markets.
Top growth suburbs above $3 million
| Suburb | State | Region (SA4) | Median house price | 12 month change ($) | 12 month change (%) | |
| 1 | Warrawee | NSW | Sydney – North Sydney and Hornsby | $4,900,000 | $1,375,000 | 39% |
| 2 | Surfers Paradise | QLD | Gold Coast | $4,000,000 | $1,000,000 | 33% |
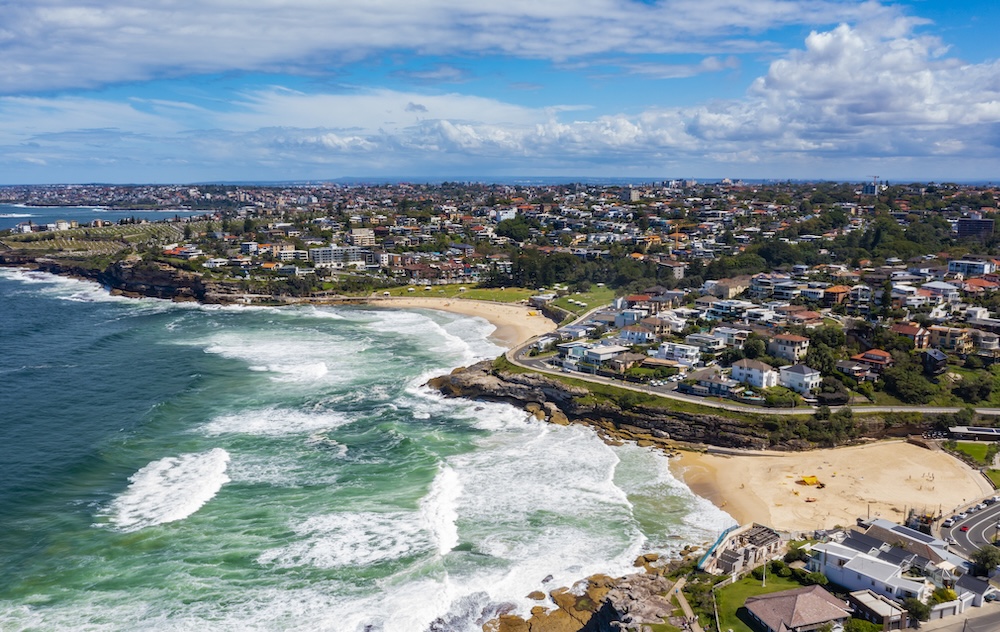
| 3 | Bronte | NSW | Sydney – Eastern Suburbs | $6,202,500 | $965,000 | 18% |
| 4 | East Lindfield | NSW | Sydney – North Sydney and Hornsby | $4,190,000 | $770,000 | 23% |
| 5 | Balgowlah Heights | NSW | Sydney – Northern Beaches | $4,520,000 | $670,000 | 17% |
| 6 | Dover Heights | NSW | Sydney – Eastern Suburbs | $7,000,000 | $550,000 | 9% |
| 7 | Portsea | VIC | Mornington Peninsula | $3,752,000 | $502,000 | 15% |
| 8 | Bayview | NSW | Sydney – Northern Beaches | $3,392,500 | $472,500 | 16% |
| 9 | Cammeray | NSW | Sydney – North Sydney and Hornsby | $3,500,000 | $462,500 | 15% |
| 10 | North Curl Curl | NSW | Sydney – Northern Beaches | $3,725,000 | $460,000 | 14% |
Ms Flaherty said interest rate reductions had the potential to spur even bigger price moves in pricey areas, although that would depend on how far cuts go.
“Typically speaking we see a relatively greater impact of interest rates on the top end of the market,” she said.
“The average loan size is going to be higher for suburbs where you have a higher median price.”
“Lower interest rates are going to have an impact on all markets, but potentially in the higher end, the impact would be greater.”
No responses yet